IR Thermography from UAVs to Monitor Thermal Anomalies in the Envelopes of Traditional Wine Cellars: Field Test Leave a comment
Abstract: Infrared thermography (IRT) techniques for building inspection are currently becomingincreasingly popular as non-destructive methods that provide valuable information aboutsurface temperature (ST) and ST contrast (delta-T). With the advent of unmanned aerial vehicle(UAV)-mounted thermal cameras, IRT technology is now endowed with improved flexibility froman aerial perspective for the study of building envelopes. A case study cellar in Northwest (NW)Spain is used to assess the capability and reliability of low-altitude passive IRT in evaluating a typicalsemi-buried building. The study comparatively assesses the use of a pole-mounted FLIR B335 cameraand a drone-mounted FLIR Vue Pro R camera for this purpose. Both tested IRT systems demonstrategood eff ectiveness in detecting thermal anomalies (e.g., thermal bridges, air leakages, constructivesingularities, and moisture in the walls of the cellar) but pose some difficulties in performing accurateST measurements under real operating conditions. Working with UAVs gives great flexibility for theinspection, but the angle of view strongly influences the radiometric data captured and must be takeninto account to avoid disturbances due to specular reflections.
Keywords: drone; thermal inspection; heat leaks; cellar; winery; thermal bridges; infraredthermography; wine maturation; UAS
1. IntroductionTemperature influences almost every step of wine production, starting with the growing of the grape [1], but is particularly important for several reactions involved in the process of winematuration [2,3]. Since many of these reactions are physiochemical in nature, they can be acceleratedwith high temperatures [4,5]. Overall, ignoring the singularities of each wine variety, to reduce winelosses and prevent rapid ageing and loss of quality, the wines should be stored at a cool cellar ambientair temperature (AAT). The final wine quality can be more precisely controlled by using the method of AAT monitoring inside the ageing rooms [6] or even sensors embedded inside wine barrels [7].The introduction of modern cooling systems to the wine industry has allowed excellent wines to be produced almost anywhere in the world, with a high degree of independence from the surroundingclimate. However, energy use during wine production still represents a high percentage of the totalelectricity used by the winery [8]. Many studies highlight some advantages of traditional cellars overmodern construction practices from the viewpoint of energy savings [9,10]. The bioclimatic strategiesof these buildings encompass suitable management of thermal inertia (frequently through the use of buried or semi-buried structures, which benefit from the high thermal inertia of the ground) [11], in most cases together with an adequate orientation and appropriate natural ventilation [12]. The newglobal strategies and energy directives towards achieving nearly zero-energy buildings have again putvalue on many of these traditional buildings for winemaking.Nevertheless, materials mightnot performas expected, and itis quitecommon tofind mismatches between predicted and actual performance in buildings [13–17]. For this reason, thermal bridges,essential components of the transmission heat loss, have to be properly evaluated within the energyaudit procedures. In that sense, techniques based on infrared thermography (IRT) have becomeincreasingly popular in recent years due to their quickly obtained and reliable results in envelopeinspection and their non-invasive nature [18–21].
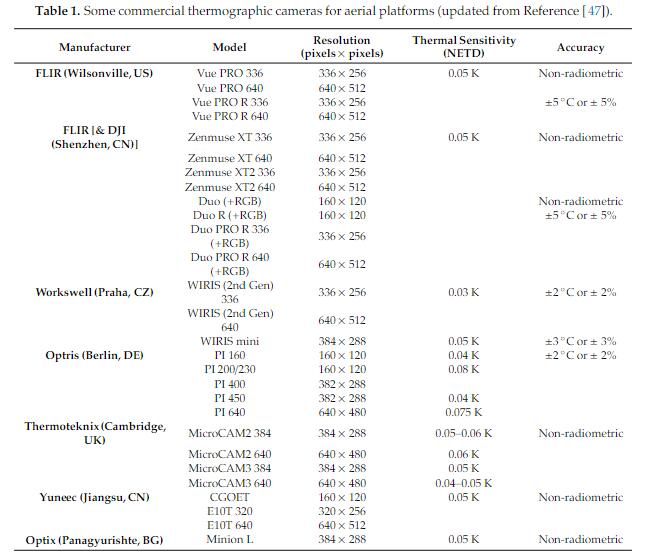
2. A Brief Recap of IRT’s Key Issues2.1. IRT in Building InspectionIn the general context of buildings, thermography has been mostly used to investigate aspects of the building envelope [22–24]. In such applications, an IRT sensor can be eff ectively used to assessthe temperature distribution across the interior or exterior closing surfaces, i.e., roofs and walls [25].Two diff erent approaches to envelope inspection using IRT have been widely implemented: Passiveand active. In passive thermography, the surface temperature (ST) is recorded without any externalheatstimulation, astheobjectitselfactsasathermalsource. Incontrast, activeIRTusesanexternalheatstimulus to increase the thermal contrast (delta-T). For this reason, the second (active) option might be more eff ective for detecting air infiltrations [26,27]. However, the need for artificial interventiongenerally poses practical challenges for in-field implementation. Moreover, environmental variablesmight also interfere with induced thermal flows [28], frequently making active IRT unsuitable forapplication in real working conditions. Therefore, in this paper, the use of the passive strategy isexclusively analysed.PassiveIRTistypicallyassociatedwithqualitativeanalysis,sincethemainaimistodetectpotentialanomalies in the thermograms representing defects in the envelope. This approach focused on thermalcontrast evaluation is commonly applied in diff erent types of building analysis, e.g., to identify wallareas with an anomalous water content [29–31], to identify points of air leakage and thermal bridgesthrough the building envelope [32–34], or to identify non-visible defects in building structures andmaterials, such as sub-surface cracks [35]. The procedures for enhancing anomalies in thermograms by means of image processing techniques have also been the subject of several studies (e.g., iterativefiltering [36] or principal component analysis [31]).In contrast, passive IRT is also frequently used for envelope study using a quantitative approach.In this case, the objective is to evaluate the magnitude / importance of the target defect, so themeasurement accuracy takes on special relevance [22,37]. In such cases, thermal audit campaignsrequire an in-depth study of the specific parameters dependent on the material, such as the emissivityand reflected apparent temperature (RAT) [23,38]. Such studies could be feasible under fully controlledlaboratory conditions, but in a real operating inspection, the ideal input values for these parametersare almost never achievable [39]. Individual corrections to the emissivity and RAT are difficult toapply in such cases because real scenarios often generate thermograms containing a variety of surfacematerials. Even directly related parameters involved in the determination of the emissivity andreflectivity (i.e., surface morphology, roughness, oxidation, spectral wavelength, and view angle) mayvary considerably within the same thermogram and material. These variations in thermal behaviourpose difficulties in defining an exact emissivity coefficient and justify in part the use of tabulated orreasonably approximate values, assuming an ST reading error that must be quantified.With changing environmental conditions, such as AAT and relative humidity (RH), not only thethermal conductivity but also the specific heat and density of materials vary, which also may slightlyinfluence the heat transfer through the building envelope. Wind can also significantly influence theheat losses through the building envelope and the thermal measurements over facades and thus should also be considered [36,40]. Numerical analysis in controlled experiments has allowed useful relations between perceived radiation and climatic parameters, e.g., the modelled atmospheric transmissioncoefficient[41]ortherelationbetweenwindvelocityandthe Ψ-value(linearthermaltransmittance)[42],to be established. Thus, the influence on non-stationary environmental parameters may be, to someextent, reduced by carefully monitoring them during inspection [19].2.2. Aerial IRT InspectionThethermographysectorhasundergonesignificantadvancesinthelastfewdecades; foruncooledcamera systems, thermal sensitivities (or, equivalently, random noise levels) already reach values<0.03 K in some commercial models. However, the newest revolution in IRT certainly comes fromthe democratization of unmanned aerial vehicle (UAV) technology and the emergence of lightweightdevices easily assembled on board (Table 1). The integration of thermal sensors with drones opensup new possibilities for real-time aerial inspection in many fields. The substantial capture capabilityof the UAV platforms allows their application in thermal inspection of large areas (e.g., vegetationstudies and precision agriculture [43–45], hydrological [46] or industrial inspections, such as those of photovoltaic farms [47,48]).
The study of building envelopes is perhaps where the fusion of IRT and UAV technologies has thegreatest potential [49–52]. UAV-mounted thermal cameras can provide low-altitude aerial images withflexibility and with information about both qualitative and quantitative scenarios. Thus, the methodcould be particularly well suited to locating difficult-to-access areas of the façade or the roof, where
the thermal conductivity is higher than in areas with thermal bridges, air leakage, or the presence of moisture in the walls.In summary, assessing thermally related phenomena via passive IRT is possible yet difficult if aquantitativein-fieldevaluationisintended. ThemeasurementsobtainedwithIRTdevicesarebiasedbyanumberoffactors,suchasthebuildingmaterialroughness,surfacecolourorshape[53],thermophysicalpropertiesandoperatingconditions[38],climaticconditions[54],timeofday(orientationofthebuilding,sunbeams and shades) [35], the angle of tilt of the sensor and disturbances due to multiple-sourcereflections [18,22,38]. Both the terrestrial and aerial IRT approaches are susceptible to influence by allthese factors. Nevertheless, in the case of a more flexible perspective when positioning the sensor,the angle of tilt in particular should be carefully studied when UAV-mounted thermal cameras areused to achieve reliable accuracies.The objective of this research is to evaluate the capability and reliability of combining passivethermal IR sensors with low-altitude platforms as building diagnostic tools. More specifically, bypresenting the case study of a typical semi-buried wine cellar, four independent steps, directly relatedwith the combination of platform and sensor, were addressed: (i) Assessing the capability of combiningliftingplatformsandIRT-compatiblelightweightsensorsindeterminingbuildinganomalies(qualitativeassessment), (ii) finding the optimum lifting platform in terms of operativity and cost, (iii) quantifyingtheaccuracyofthermalimagingsystemsusuallychosenforthistypeofstudy(quantitativeassessment),and (iv) analysing the impact of the angle of tilt on ST measurements.3. Materials and Methods3.1. Study Site3.1.1. The BuildingThe study was performed in a cellar situated in O Saviñao (42◦33′N, 7◦40′W, altitude: 399MAMSL, Figure 1a) within the provincial council of Lugo (Spain). This cellar was built in the late1920s to produce wines on a small scale. Throughout its history, the structure has undergone severalchanges and expansions, in accordance with the needs derived from business growth. In most cases,the reforms have not been properly documented (e.g., the internal structures of some of the walls areunknown). These changes have endowed the building with constructive singularities and a diversityof materials. The Southwest façade is half-buried to help maintain a balanced internal AAT throughoutthe year. Nevertheless, apart from this feature, being an old construction, the cellar does not possessany extra measures for saving energy or maintaining environmental conditions. The outside of thewalls is mainly composed of granitic stones, and the roof is covered with red clay tiles. The doors andwindows, as well as the framework that supports the roof, are made of wood. Inside, white ceramictiles are used to cover the walls, and solid ceramic bricks are used for the central pillars and the floor.Being a semi-buried building is an important characteristic that gives the cellar a high inertiaagainst temperature fluctuations, but practical difficulties have been historically reported for IRTapplications in buildings with such a large thermal inertia, as studying their thermal behaviourwould require long measurement periods [55]. In this sense, time-lapse experiments using passive IRTmethodsalsoencounterseveralconstraints(e.g.,thesecureandsafepositioningofequipment,avoidingoccupant interference or unwanted foreground objects, and challenges associated with continuousmonitoring of environmental conditions) [56].In 2005, the owner constructed a new building nearby to house the equipment for the initialwine-processing steps. Since then, the old building (Figure 1 b) has been dedicated almost exclusivelyto ageing the wine in barrels (on the ground floor, Figure 1c) and occasionally to receiving visitors (onthe first floor)

Figure 1. (a) Location of the study building (A Cova, Lugo) and images of the cellar from (b) outside(main façade) and (c) inside the wine-ageing room (ground floor).3.1.2. The ClimateAccording to the Spanish Technical Building Code CT-DB-HE [57], several climatic zones can bedistinguished in the country. This diversity of zones leads to various wine-producing regions, alsoknown as denominations of origin (or DOs). Specifically, the case study cellar belongs to DO RibeiraSacra, where the mean annual AAT is approximately 14 ◦C, and the average annual rainfall is 900 mm.The microclimate of the region shows Mediterranean and continental influences, a consequence of itsgeographic location as well as its particular orography (steep hillsides along the edges of the Miño andSil Rivers) [58,59].3.2. Equipment3.2.1. Measuring InstrumentsThe measuring instruments employed were as follows:–(1×) Hobo data logger (model U12, Onset, Massachusetts, US) (with 4× ext. channels) formeasuring the AAT inside the wine cellars. Its parameters included a 0.03 ◦C resolution and a+0.35 ◦Caccuracy for AAT.–(2×) Hobo data loggers (model U23-001 Pro v2) for measuring both indoor and outdoor ambientconditions (AAT and RH). Their parameters included a 0.02 ◦C resolution and a+0.21 ◦C accuracy forAAT and a 0.03% resolution and a +2.5% accuracy for RH.–A Temp 7 portable thermometer (XS Instruments, Carpi, IT) equipped with a PT56C contacttemperature probe to obtain ST measurements for cross-checking the thermal images. The accuracy of this device was +0.15 ◦C (120 s).The locations of the data loggers are represented in Figure 2. The sensors were placed inside theageing room, on the back side of the central pillar, to protect them from possible abnormal cooling dueto air infiltration from open doors or windows. The diff erent channels of the Hobo U12 were situatedat height intervals of 90 cm to obtain an average AAT of the room, reducing the eff ects of convectiveprocesses in the measurements. At the same pillar, a Hobo U23 data logger was also placed to registerRH and provide a contrast measurement for AAT. The external data were registered by another HoboU23 data logger, placed on a mast 1 m above the lowest ceiling of the cellar and inside a shield thatprotected the logger from rain and solar radiation.

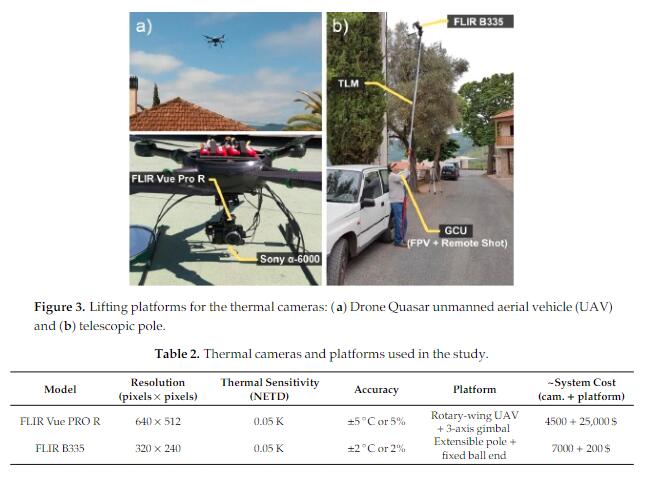
Figure 2. Distribution inside the cellar of the (a) logger positions and images of the (b) indoor loggersinstalled in the wall and (c) the outdoor logger.3.2.2. Thermal camerasTwo thermal cameras were chosen to determine the wall ST without contact. The first onewas a Vue Pro R (FLIR Systems, Inc., Wilsonville, OR, US), an IR camera specially designed to bemounted onboard a drone. The “R” in the name means “radiometric”, which allows this camera to be diff erentiated from the standard non-radiometric model from the same manufacturer (FLIR VuePro). The second IR camera was a FLIR B335, which is a conventional hand-held thermal imagingdevice. The B335 is also radiometric, which means that both devices allow non-contact measurementsof per-pixel calibrated ST. In principle, radiometric devices should more accurately reflect the actualthermal radiance of surface features and thus enable additional post-processing and analysis. The FLIRResearchIRsoftwarepackage,fromthesamemanufacturer,wasemployedtoperformfurtheranalysisof the raw data, allowing tuning of the thermal level and span, colour palette modification, adjustment of parameterssuchastheemissivityandthereflectivetemperatureanddirectimportingofenvironmentaltime series data from the loggers.3.2.3. PlatformsTo elevate the FLIR Vue Pro R thermal camera to capture images of the exterior of the cellar, acommercial ready-to-fly Drone Quasar UAV (DroneTools, Sevilla, ES) was used. This rotary-wingquadcopter (Figure 3a) has an autonomy of approximately 1 h and a payload of 1.2 kg. A specialgimbal provided by the same manufacturer allowed the thermal camera and a conventional RGBmirrorless camera (ILCE α 6000, 24 MP; Sony Corp., Minato, JP) with synchronized shoots to bemounted simultaneously. The dual onboard video transmitter allowed the RGB and IRT signal to be transferred from the drone to an audio-visual (AV) screen, giving the pilot a first-person-view(FPV), which guaranteed that the region of interest (ROI) was truly being captured. To compare theoperativity of this high range UAV system (~$25,000) with a low-cost alternative lifting method, asimple pole (~$200) was also used. The telescopic device (Figure 3 b) used to elevate the FLIR B335was composed of three main parts. The first part was a (1) telescopic lifting mast (TLM) composed of lightweight materials (aluminium and plastic) with a maximum working length of 7 m. However,working with the pole extended more than 5 m generally requires the help of another operator. At theextreme of the pole, a (2) ball-head mount locked the camera solidly in the desired position. In thiscase, the adjustable locking system was not included with the pole; therefore, an adapter was attached
to the standard system. Finally, the (3) ground control unit (GCU) also included FPV glasses and theshoot button, which were commercial devices directly wired to the camera. The GCU was designed to be operated by only one person. Table 2 provides a summary of the equipment used.
3.3. Data Acquisition and Post-ProcessingThemeasurementcampaigntookplaceonthe12June2017andwasdividedintothreeindependentsteps (chronologically, A, B, and C).The first one (A) involved taking thermograms over common points to perform a comparativeassessment in terms of accuracy. Twenty pairs of points apart 30 cm (10 inside and 10 outside the cellar)were selected over uniform surfaces, covering the main surface types of the building (roofs, stone walls, brick walls and painted walls). The points were arbitrarily selected over the surface (avoiding materialdiscontinuities) and marked with sticky tape defining squares 4 cm on a side. To guarantee similarenvironmental conditions during the capture of images, both the procedures with the pole camera(B335) and those with the drone camera (Vue Pro R) were performed at the same time. Two diff erentoperators simultaneously took thermograms from the same distance (3 m) in a direction perpendicularto the surface. The FPV devices systems ensured the images were centred on the points. The contactthermometer was also positioned with an extensible tripod in every scene, registering the ST in themiddle of the reference points at the time of the shots and taking the other measurement just afterthe shots. After post-processing, the mean values of pixels corresponding to the target points werecompared with the reference temperatures from the contact thermometer.In a second step, a similar test (B) was performed with the drone over two fixed points on theSW and SE façades, varying the height (consequently, also the angle of tilt) and keeping a constantdistance to the surface of 3 m. Twenty diff erent shots per point were captured, slightly raising thedrone between every shot. The heights of the images were automatically determined with the GPS andrecorded in the metadata of every image. Thus, the angle could subsequently be easily determined.
The remaining images of the whole envelope were collected in a third step (C), which was simplyaimed at qualitatively detecting anomalies. Therefore, these sets of images were taken independentlywitheachsystem. Notably,theperformanceoftheUAVwasmuchhigherthanthatofthepole-mountedcamera, but the operation time of the former was more limited by the battery’s duration. For thisreason, the procedure with the UAV was completed more quickly. Both the flight and the path fortaking images with the pole-mounted camera were planned to cover the entire exterior surface of the building (i.e., the façades and the roof) while minimizing the number of photos. Nevertheless,extra images were taken in areas of particular interest for thermal inspection (e.g., windows, corners,and material discontinuities). Inside the wine-ageing room, due to height limitations, flying the dronewas not possible. The entire surface was thermally inspected with the B335 without the pole. In someareas of interest, some photos were also taken manually with the Vue Pro R, after disassembling thecamera from the quadcopter.To prevent the influence of direct solar radiation on the measurements, the outdoor data capturestarted at 9:00. Then, steps A and C were both repeated indoors, starting at approximately 11:00, just atthe end of the outdoor campaign. At this time, the exterior logger registered an AAT 3.5 ◦C higherthan that detected at 9:00, which helped maximize the contrast between the inside and the outside andthe detection of potential hot air flows.The conditions of the wine cellar described above were monitored during the ten days prior tothe thermal inspection and on the inspection day. The AAT and RH values inside the cellar wererecorded every 5 min during the period from the 2nd to the 12th of June. This month usually marksthe beginning of the most problematic period for the ageing of wines because of the rising temperature,which increases the risk of wines being damaged [10]. Particularly, in the month of the test (June 2017),6 days with a maximum AAT above 35 ◦C were registered in the area according to the data of thenearby weather station of Pantón (42◦32′N, 7◦42′W, altitude: 340 MAMSL).Data registered by the loggers were used to correct the atmospheric attenuation, thus improvingthe reliability of the thermal measurements. The images were post-processed by introducing theseenvironmental parameters (AAT and RH) based on the exact time of every image acquisition. In thiscase study, the wind eff ect was considered negligible, as the field campaign was carried out inquasi-steady conditions. The anemometer of the nearby weather station registered speeds<1 km / hduring the field campaign, which is considered “calm” according to Beaufort’s scale. Due to the widevariabilityofmaterialsineveryimagescene,astandardvalueof0.95foremissivitywasestablished[60].Inprinciple,thisvaluematchestheusualtabulatedvalues[61,62]forallthetestedmaterials—redbricks(0.93–0.96),roughgranitewalls(0.90–0.94),paintedwalls(0.94–0.96)andredclaytiles(0.88–0.95)—witha reasonable degree of accuracy.4. Results and Discussion4.1. Building Diagnosis with IRT A detailed analysis of the exterior image collection provides a diagnosis of the entire enclosure of the cellar. Several problems, such as the loss of thermal insulation in roof tiles over time (Figure 4a)or the presence of moisture in the walls (Figure 4c), with this method have been detected. Old walls,unlike modern walls, do not have a predictable internal structure and often contain random voidsthat inhibit moisture flow and hence heat transport [63]. In such cases, qualitative visualization of the imagery usually allows eff ective interpretation. In this sense, passive IRT is very useful not onlyfor assessing damages or understanding the structure of historical monuments [64–66] but also forcharacterizing buildings such as this one that have been constructed or refurbished in an unorderedmanner and whose characteristics are often unknown. Figure 4 b shows how a part of the old wallhas been maintained in the current enclosure of the cellar, producing a clearly diff erentiable thermal behaviour (i.e., visible delta-T) .

Figure 4. Sample thermal inspection images of the building from the exterior: (a) Aerial image of theroof from the drone with the FLIR Vue Pro R and (b) and (c) two images for wall inspection taken withthe FLIR B335. Some detected thermal anomalies are highlighted: (I) a recently replaced group of roof tiles, (II) diff erent coverings of the Southwest façade, and (III) water filtration through wall cracks inthe Southeast façade. The temperature scale is in ◦C.Detectinginteriorthermalanomalieswasdifficultbecauseofthestronginfluenceofthebackgroundreflections from the ceramic tiles. Regardless, the inspection of wooden elements of the building(Figure 5) revealed some insulation problems in the joineries and subflooring
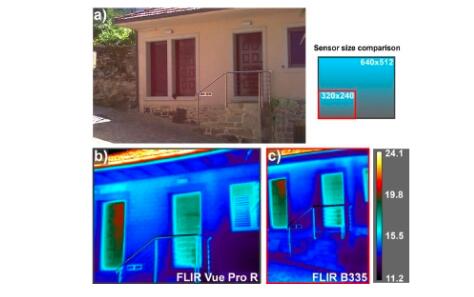
Figure 5. Thermal inspection of joineries inside the cellar: (a) Main door, (b) wooden ceiling of thewine-ageing room, and (c) a wall with a window. Some examples of detected thermal anomalies arehighlighted: Air leakages (I) beside the door and (V) above the window, which heat the surface of thesurrounding walls, (II) diff erences in the thicknesses of the upper and lower door leaves, (III) thermalradiation reflected by the ceramic tiles, which introduces noise into the image, and (IV) an area betweenfloor joists with missing insulation. The temperature scale is in ◦C.Based on the results, several recommendations that would improve thermal comfort are proposed.The joineries should have mechanisms for thermal bridge breakage, and double glazing should be applied. Coating the pillars and reinforcing the insulation layer in the subfloor are other recommendedmeasures to improve energy efficiency.The performances of both tested cameras in the qualitative analysis were overall satisfactory.Evenso,itispossibletoappreciatesomemissingdetailsinthethermogramsderivedfromtheB335aftertesting the cameras from the same distance to the surface (Figure 6). The sensor size is a very relevantparameter for thermal inspection as the number of pixels describing each spatial feature increaseswith the size of the sensor. The focus and blur of thermograms can also influence the sharpness of thefeatures to be detected .

Figure 6. (a) RGB (red-green-blue) images of part of the building and thermograms obtained from thesame point (~4 m from the façade) with (b) the FLIR Vue Pro R and (c) FLIR B335 cameras. The samecolour palette and ST scale are used. The temperature scale is in ◦C.4.2. The Camera PlatformObtainingquantitativeresultsfortheplatformwasquitedifficult, mainlybecausethetwocamerasusedwitheachplatformwerefundamentallydiff erent. However,thethermalsurveyprocedureallowedcertain results regarding the suitability of the platforms for the work on this cellar to be obtained.The first result is about the performance of the two lifting platforms outside the cellar, where bothwere tested. The capture of some images was planned to be done in a simultaneous manner to obtaincomparative thermal measurements, not with the objective of assessing performance. Nevertheless, inthis study, the efficiency of the drone far outweighed the performance of the work done with the pole.The total numbers of images taken outside with the drone and with the pole-mounted camera were321 and 110, respectively, for the same time of acquisition (approx. 1.5 h).The pole is a quite useful instrument (and much less expensive than the UAV) that allows thermalinspection of buildings without excessive height, such as this building. Even so, the pole used in thiscase study is a basic model that lacks any system to avoid oscillations at full height. Even with thehelp of an auxiliary tripod and a second operator, the camera was not easily fully stabilized at heightsgreater than 5 m. The fixed-head system of the pole is not as flexible as the drone gimbal. This 3-axismotorized gimbal allows the camera to always be oriented at the desired angle to the inspected surfaceto improve the IR accuracy. The use of a remote pan and tilt system with the pole is almost essentialfor thermographic inspection. Otherwise, the procedure is much more laborious, since the cameramust be lowered to the ground to orient it manually.Inside the cellar, flying the drone was technically impossible due to the low ceiling. Overall, inclosed places or within confined spaces, the pole has demonstrated to be a better alternative becauseit allows the sensor to approach the ceiling or other elements without risk of collision. In contrast,outdoors, the drone can perform exhaustive capture, including of the most difficult-to-access areas,
such as roofs, without compromising the safety of the operator. The UAV can approach the wallseven at full height to obtain a very fine spatial resolution, which allows, for example, visualization of small heat leaks around joineries. The flight can be configured in automatic mode, in which case asingle operator can focus on camera handling. However, thermal inspections are usually performed inmanual mode with two operators to separately control the aircraft and the camera. The use of theUAV as a lifting platform for the camera is not a trouble-free method. The presence of obstacles inthe environment (e.g., power lines, trees, and other buildings), the need to obtain a flight licence andpermissions, the dependence on weather conditions, and especially the higher cost of the equipmentare some of the important drawbacks.4.3. Accuracy Assessment of Thermal ImagesWith the aim of calibrating the readings, the environmental conditions of the cellar (AAT andRH) were monitored during the 10 days prior to the test (Figure 7). Outside the cellar, the maximumAAT registered by the logger was 30.65 ◦C at 16:15 on the 10 June, the minimum AAT was 7.42 ◦Cat 6:25 on the 5 June, and the average AAT during this period was 17.20 ◦C. The diff erence betweenthe maximum and minimum temperatures was quite high (~23 ◦C), which is typical of a continentalclimate. Regarding the RH, the maximum value for this period was 99.97%, and the minimum was30.02%, with a mean of 72.17%

Figure 7. Data recorded by indoor and outdoor data loggers: (a) ambient air temperature (AAT) and(b) relative humidity (RH) during the 10 days prior to the test (from the 2nd–12 June 2017) and (c) AATand (d) RH during the three hours of the thermal imagery campaign (from 09:00–12:00 on 12 June 2017).Inside the wine-ageing room, the maximum AAT was reached at 18:30 on the 10 June (19.58 ◦C),and the minimum AAT was reached on the 7 June at 9:05 (16.89 ◦C). The RH varied from 62.52–79.23%,withameanvalueof72.56%duringthisperiod. Becausethecellarwasasemi-buriedstructureincontactwith the ground, the indoor environment was protected from extreme variations in outdoor conditions.Atotalof20pairsofpointswereselectedfromtheentiredatasettoperformanaccuracyassessmentof the measured ST. These images were post-processed with the FLIR ResearchIR software package,taking into account their specific parameters (such as the RH, AAT, and distance to the object). The STmeasurementsweremadetwicewiththecontactthermometerperimage(attwopointsontheinspectedsurfacespacedinheightby30cm), andthemeanvaluewascalculated. Figure8showsthecomparativeresults of this test

Figure8. Image-basedsurface temperature (ST)valuesvs. contact measurements (PT 56C)for 20imagesamples. *The FLIR Vue Pro R camera was disassembled from the quadcopter to take indoor images.The pole-mounted B335 camera obtained ST values with a bit more correlation (R2=0.39) withthose taken by the contact probe than did the Vue Pro R camera. The Vue Pro R camera, despite itshigherimageresolution,whichprobablymakesitbetterfordetectingthermalanomalies,presentedlessaccuracy in the readings. Nevertheless, these results should be interpreted with caution, because beinga field test some variables have not been considered, and the results represent the behaviour of thewhole system (the pair camera / platform) under real operating conditions. Potential highly influentialparameters like emissivity have been used from tabulated values and others like reflections are almostuncontrollable in a field test. Moreover, other internal parameters and camera settings also could haveinfluenced the radiometry captured by the sensor. The Vue Pro R was equipped with the largest focallenses (f =19 mm) within its available commercial range of configurations (6.8 mm–19 mm), whichmight have increased the error in the thermograms. In principle, the larger the field of view (FOV=2arctan(sensor size / 2f)) is, the smaller the error in the temperature measurement is [67]. Therefore,using the same sensor, more accurate measurements are expected with shorter focal lengths.As expected, the indoor ST data showed less variability than the outdoor ST data in themeasurements taken by either of the two thermal cameras (Figure 8). The standard deviationof the ST diff erential (Tprobe-Timage) outdoors was almost double that indoors (σ = 2.67 and σ= 1.34, respectively). These results are reasonable, as it is easier to obtain stable environmentalconditions within the cellar, without exposure to any direct sunlight or wind gusts that could introduce biased readings.Both radiometric cameras supposedly have the same thermal sensitivity (0.05 ◦C) but diff erentaccuracies (2–5 ◦C or 2–5% of the reading). Comparatively, the correlations between contact STmeasurements and ST from thermograms were quite consistent with the sensor’s accuracies provided by the manufacturer. Nonetheless, for some few in-field-sampled points, the errors far outweighed therange of accuracies indicated above, reaching diff erences>6 ◦C. Thus, in thermographic ST measuring,it is also extremely important to consider the sources of external uncertainty, especially in real workingconditions. The procedure described in Muniz et al. 2014 [68] to obtain combined uncertainty could beuseful for estimating errors in those cases. From the law of propagation of uncertainty and consideringthe input parameters for ST individually, the standard error of thermography can easily exceed 3 ◦C.Moreover, the analysis of sensitivity revealed a particular influence of emissivity on the uncertainty;therefore, the use of tabulated values is inadvisable for obtaining reliable measurements. It is alsoimportant to keep in mind that the contact thermometer has a 0.15 ◦C resolution with a rectangular
distribution, since it is a digital instrument, but its own measurement uncertainty outdoors can reachvalues of ~1 ◦C.4.4. The Influence of Angle with the SurfaceOverall, when a thermal camera is close to a surface, it often records heat not only from the surfaceitself but also reflected from the background environment. Thus, measuring the ST of very reflectivesurfaces, such as the ceramic tiles of the cellar, is particularly challenging because of backgroundreflections (e.g., Figure 5a (III)). In these cases, avoiding straight-on measurements is advisable.Too large of an oblique angle can introduce potential biases in radiometric measurement, as it reducesthe ability to capture the emissivity of the material and can capture overall reflections from otherunwanted sources [69,70]. However, there is evidence that the characteristics of the thermal imagerassociated with the viewing angle also introduce measurement errors.Outside the cellar, the coverings of the façades, mainly composed of stones with rough surfacetextures, did not pose as many reflection problems as the ceramic tiles. Regardless, due to the greaterexternal influence of solar and sky radiation, measurements may also have been aff ected by reflections.Figure9ashowstheaccuracyassessmentperformedbycomparingtheradiometricSTvaluesmeasuredwith the Vue Pro R camera and the contact probe in relation to the angle of incidence. The contactmeasurements were taken at fixed points on the SW and SE façades of the cellar, while the imageswere captured by varying the flight height of the drone

Figure 9. Influence of the angle of incidence on radiometry: The box plot (a) shows the diff erences between image-based ST values and contact measurements (PT 56C) vs. the angle of view, and thesketch (b) represents the thermal emission and disturbances due to reflections.The results show a close relationship between the angle of view and the ST diff erences recorded(Tprobe-Timage) in the proposed experiment. At angles less than 45◦, the majority of the radiationrecorded by the sensor is emitted by the surface under inspection. These results are quite consistentwith those of other studies [22,67], where the measurement errors were also accentuated by 45–50◦maximum tilts. Above these values, the error in the measurement increases drastically due to theinfluence of reflections from the sky and the sun. Since the reflection phenomena are highly dependenton a number of factors (e.g., time of day, place, atmospheric conditions and surface), the precision of the ST measurement must be analysed for each particular case study. To manage this issue, taking aseries of images of the surface over a range of angles is recommended, thereby reducing the influenceof any single glint or sky reflection. However, the user should be careful when taking measurements atincreasingly oblique angles, as reflections can change and become a more serious issue (Figure 9 b).In this regard, it is also important to point out that the UAV gimbal could be manoeuvred to helpminimize the eff ects of the angle of tilt on the perceived emissivity
5. ConclusionsThe application of IRT provides a reliable qualitative assessment method for thermal inspectionof a typical wine cellar. Several problems that might compromise the optimal conditions for wineageing (e.g., moisture in the walls, insulation faults, and heat leakage through the joineries) can bedetected through thermal inspection. Thus, the information revealed by thermography facilitates theimplementationofcorrectivemeasurestoensureoptimalenvironmentalconditionsforthewine-ageingprocess. The main proposed reforms are systems for thermal bridge rupture in the joineries anddouble-glazing windows. Reinforcing the insulation layer in the subfloor and cladding the concretecolumns are other recommended measures to improve energy efficiency based on the thermography.The drone-mounted camera allows for exhaustive image capture, including in the mostdifficult-to-access areas of the cellar, such as the roofs, without compromising the safety of theoperator. However, alternative low-cost lifting methods for low-altitude thermography, such as asimple telescopic pole, can replace the use of a drone when performance is not a priority or whenspace for manoeuvrability is limited. Even though they are radiometric, the tested B335 and Vue Pro Rthermal cameras demonstrate good eff ectiveness for detecting thermal anomalies, but pose seriousdifficulties in taking accurate ST measurements. The thermal readings are particularly sensitive toparameters such as emissivity; thus, the use of tabulated or generalized values should be avoided.This fact poses challenges to in-field IRT implementation, as the heterogeneity of scenes can make thistechnique impractical under a quantitative approach. Noticeably, IRT surveying is always a complexprocess, but greater difficulties arise in real working conditions due to the difficulty of establishinga completely controlled environment for taking accurate measurements. Among other variables,the angle of view influences the radiometry captured by the sensor and must also be taken into accountto avoid disturbances due to specular reflections. Errors in the readings of lightweight devices caneasily exceed manufacturer specifications when the tilt angle exceeds 45◦.